
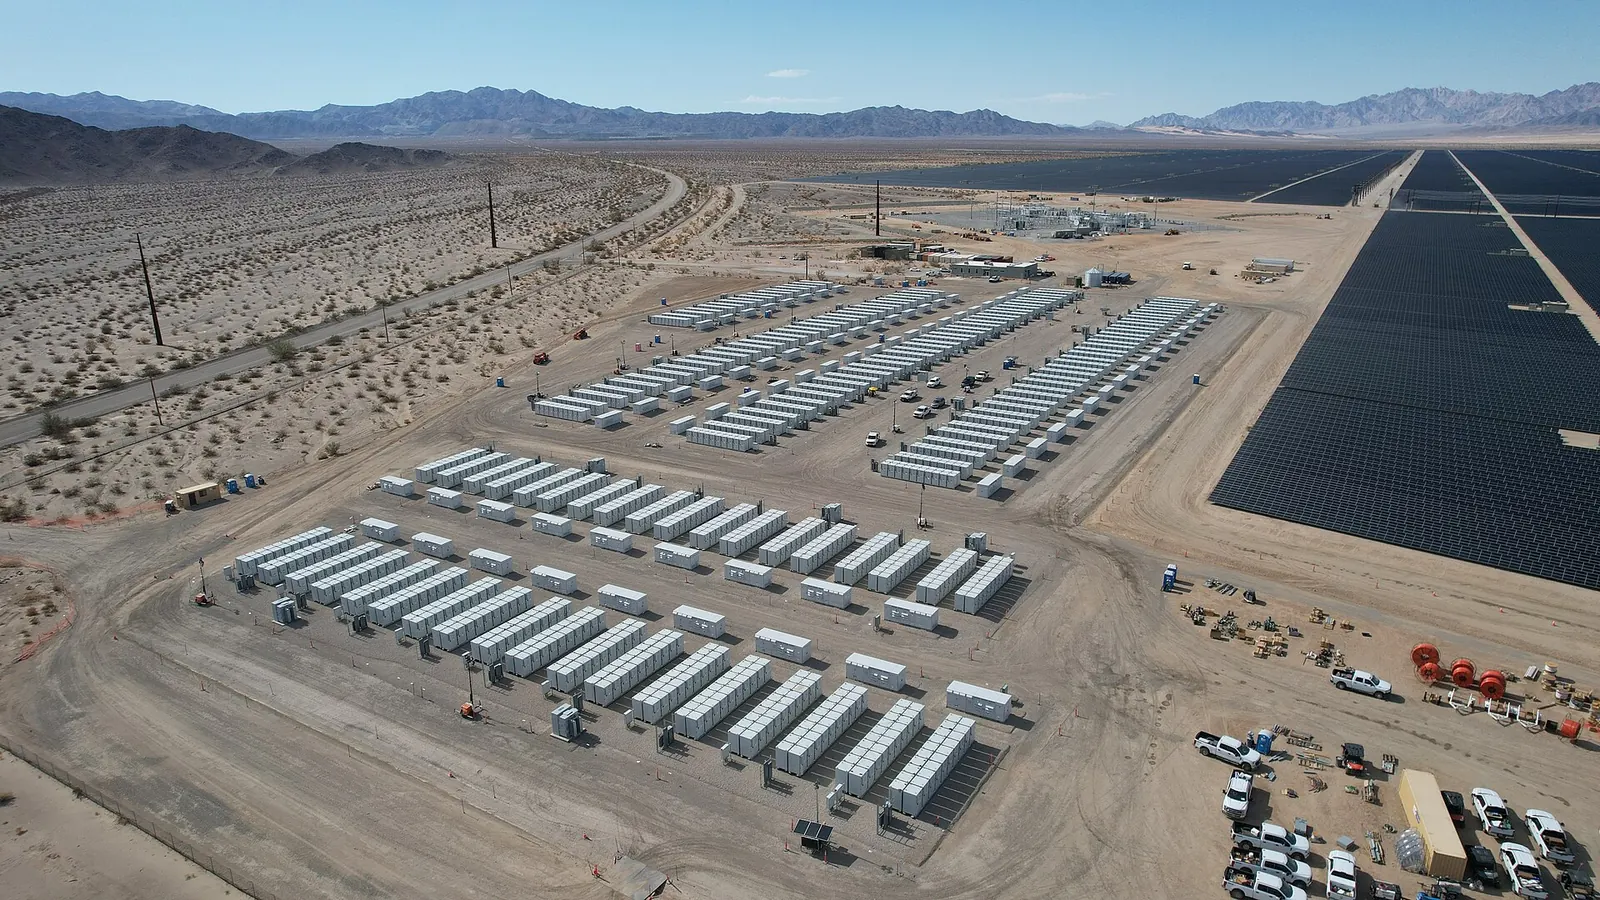
At the start of 2024, the federal statistics agency published three short notes that, read together, describe the most important change in the American power system this decade. The first said that utility-scale battery capacity could rise by 89% by the end of the year if developers bring their planned systems on line on schedule. The second said solar will supply almost all of the growth in US electricity generation through 2025. The third set out the numbers behind that claim: solar output rising 75% in two years while coal generation falls by almost a fifth. None of these is a surprise to anyone who has watched interconnection queues fill up. What is new is that the forecasts now describe a near-term operating reality, not a long-run scenario.
The question we want to ask is narrower than the headlines. It is not whether solar and storage will grow. It is whether the storage arrives in the same places, and at the same pace, as the solar it is supposed to firm, and what happens in the regions where it does not.
What the January data say
The Energy Information Administration's preliminary generator inventory shows planned and operating utility-scale battery capacity of around 16 gigawatts at the end of 2023. Developers plan to add another 15 GW in 2024 and around 9 GW in 2025. If the 2024 plans hold, US battery capacity would pass 30 GW, larger than the country's fleets of petroleum liquids or geothermal plants.
The geography is concentrated. California has 7.3 GW of installed battery storage, the most of any state, and Texas follows with 3.2 GW. The EIA links this directly to the rapid growth of wind and solar in those two states, since batteries earn their keep by charging when renewable output is high and discharging when it falls away.
On the generation side, the January Short-Term Energy Outlook puts solar at 4.0% of total US generation in 2023, rising to 5.6% in 2024 and 7.0% in 2025. In absolute terms, solar output grows from 163 billion kilowatthours in 2023 to 286 billion kWh in 2025, a 75% increase. Wind grows more slowly, by 11% from 430 billion kWh. Coal falls 18%, from 665 billion kWh to 548 billion kWh. Natural gas stays the largest single source, at about 1,700 billion kWh a year in both 2024 and 2025, roughly where it was in 2023.
The context matters. The US electric power sector produced 4,017 billion kWh in 2023, and renewables of all kinds accounted for 22% of that. Renewable generation overtook nuclear in 2021 and coal in 2022. The 2024 and 2025 forecasts extend a trend rather than starting one.
Why the timing of additions shapes the forecast
One detail in the EIA's explanation deserves more attention than it gets. Wind and solar developers often bring projects on line at the end of the calendar year, so new capacity tends to show up in generation growth the following year. That is partly why the agency is so confident about 2024. A large share of the panels that will generate this summer were already connected, or close to it, in late 2023.
Batteries are different. A storage project that slips by six months does not shift a year's worth of energy, because a battery does not produce energy at all. It shifts the hours in which energy is available. If a battery planned for May arrives in November, the system loses a whole summer peak of evening support while the solar it was paired with is already generating at midday. The capacity numbers can look fine on an annual basis while the operating problem they were meant to solve goes unsolved for a season.
This is not a hypothetical concern. Developers' stated commercial operation dates are targets, and the EIA's own framing is conditional: capacity could rise by 89% if plans are met. Supply chain constraints on transformers and switchgear, local permitting, and interconnection studies all apply to storage as they do to generation. Some of them apply with more force, because fire codes and siting disputes have followed several high-profile battery incidents.
Two states, two models
California and Texas are building storage for overlapping reasons but in very different market settings, and the difference is useful for everyone else.
In California, much of the battery fleet has been procured through resource adequacy obligations placed on load-serving entities. Storage is bought because regulators require utilities and community choice aggregators to show they have enough capacity to cover the evening ramp, when solar output collapses and demand stays high. The value proposition is close to a capacity payment.
In Texas, there is no capacity market. Batteries earn money from energy price spreads and from ancillary services that the grid operator buys to keep frequency stable. That model has produced fast deployment, but it also means the business case depends on volatility. As more batteries chase the same price spreads and the same ancillary service volumes, revenues per megawatt are likely to fall. That is the normal path of a merchant asset class, but it means Texas storage growth will be more sensitive to market saturation than California's contracted fleet.
The rest of the country can learn from both. Regions with organized capacity markets can shape storage deployment through how they accredit it. Regions that rely on vertically integrated utilities will see batteries arrive mainly through integrated resource plans, at a pace set by state commissions.
Where the mismatch could bite
Solar growth is broader than battery growth. Large solar build-outs are under way in the Southeast, the Midwest and the Mountain West, regions where storage deployment is much thinner than in California and Texas. In those areas, the early effect of more solar is likely to be what California saw a decade ago: midday prices falling, gas plants cycling down at noon and ramping hard in the late afternoon, and growing curtailment on days of low demand.
That does not make solar a reliability risk on its own terms. It makes the evening ramp a planning problem that needs a resource. Gas plants can meet it, and in the EIA outlook they continue to do so, which is why gas generation stays flat even as solar surges. The interesting policy question is how quickly storage displaces gas in the ramp, and whether utilities and grid operators are pricing the ramp in a way that rewards the cheapest option.
Coal's decline is the other side of the ledger
The 18% fall in coal generation forecast for 2023 to 2025 is the clearest sign that the combination of cheap gas and new renewables is changing dispatch. Coal plants are being run less often, and their annual output is falling faster than their capacity. That gap between capacity and generation matters for reliability debates. A coal unit that runs only in winter peaks still occupies a place in planning reserve calculations, even when it rarely sets prices.
Batteries complicate that calculus in a useful way. Short-duration storage is effective in summer evening peaks but less helpful in prolonged winter cold, when demand can stay high for days. Regions that are retiring coal while their peak risk is shifting to winter will need more than four-hour batteries. That is not an argument for slowing retirements. It is an argument for being precise about which hours a given resource can actually cover.
What to watch in 2024
Three indicators will tell us whether the forecasts are tracking.
First, monthly battery additions in the EIA's generator inventory, compared with the dates developers gave a year earlier. A persistent lag would mean the 30 GW figure is a 2025 number rather than a 2024 one.
Second, evening price behavior in markets with heavy solar but light storage. If late-afternoon prices keep rising while midday prices fall, the system is telling planners what it needs.
Third, accreditation reforms. As capacity markets and resource adequacy programs refine how much firm credit a battery receives, the value of each new megawatt will change. A battery that earns full credit today may earn less once a region has enough storage to flatten its first evening peak.
The January numbers describe a grid moving quickly in the right direction. The remaining work is matching, and matching is where forecasts tend to be least reliable.