
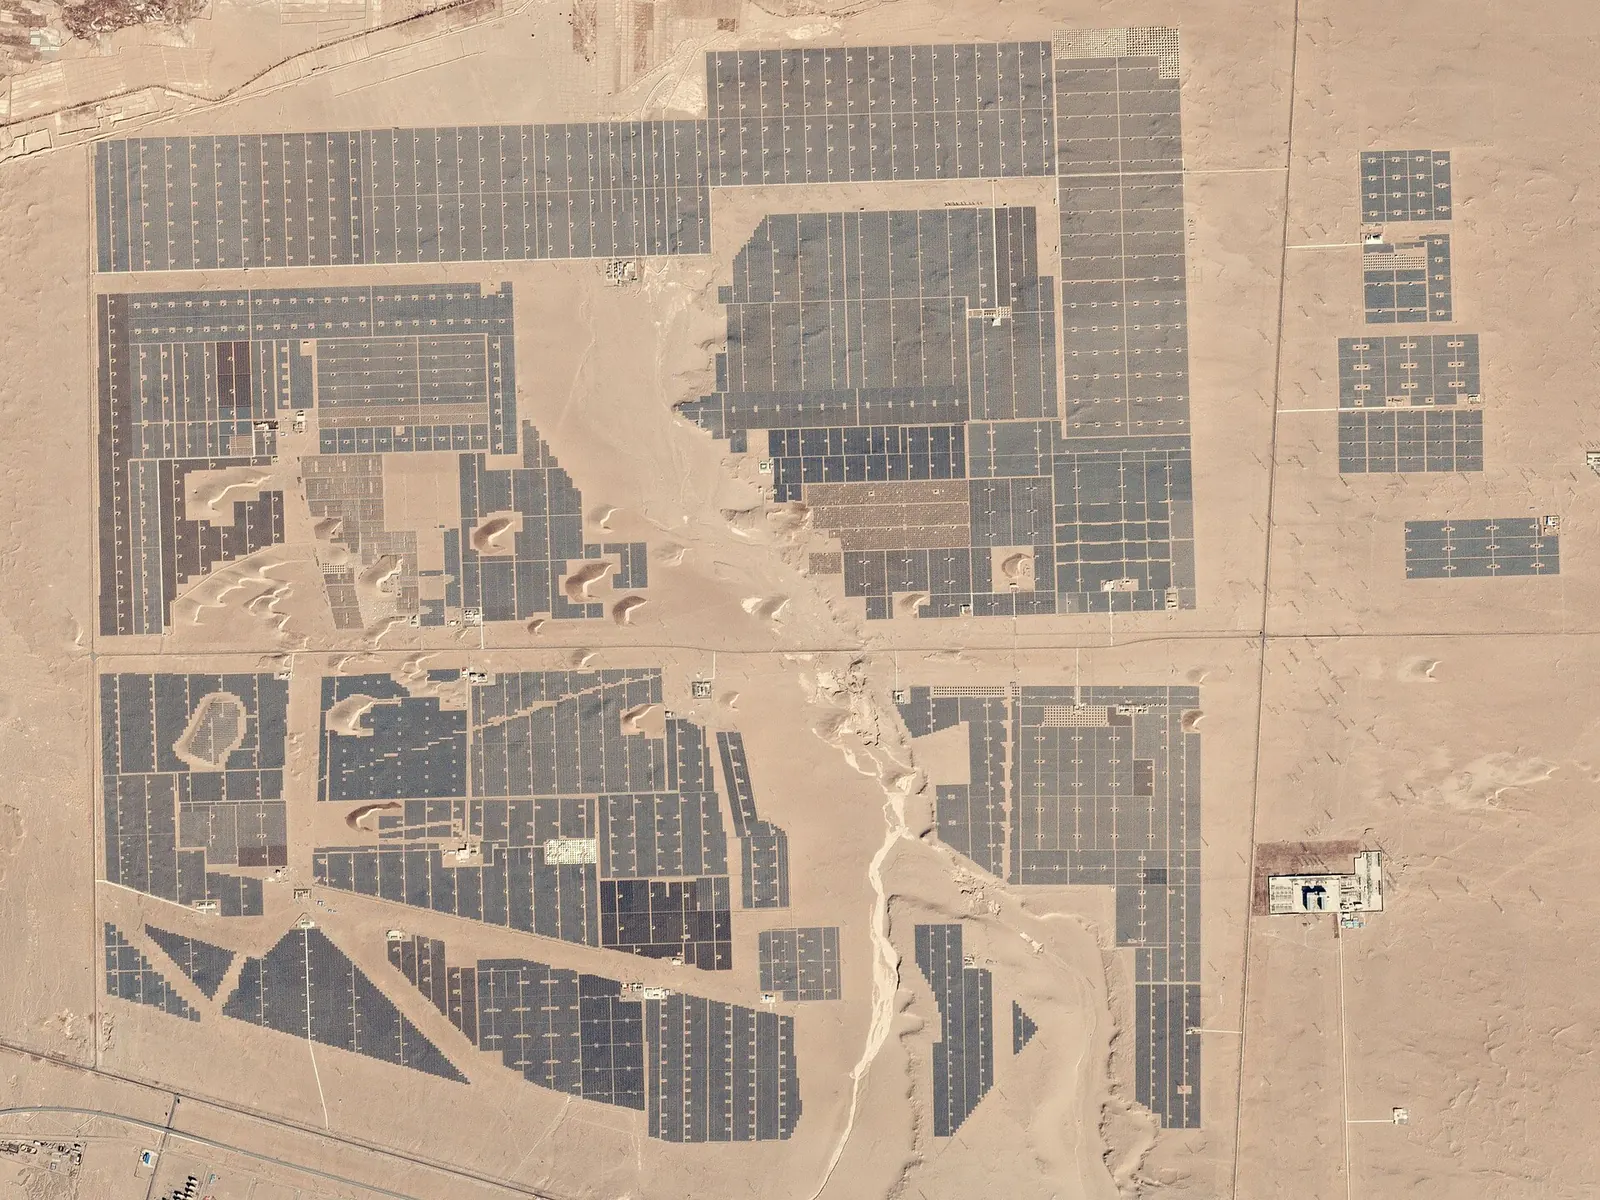
China's National Energy Administration published its 2023 power industry statistics on 26 January 2024, and the headline number deserves to be read slowly. The country connected 216.88 GW of solar capacity in a single year, up from 87.41 GW in 2022. Wind additions were also a record at 75.9 GW, against 37.6 GW the year before. By the end of December the NEA counted about 609 GW of solar and 441 GW of wind on the system, inside a total generating fleet of roughly 2,920 GW that grew 13.9 per cent in twelve months.
Numbers on that scale tend to provoke one of two reactions. The first treats them as proof that China's energy transition is effectively won. The second dismisses them as capacity without consequence, panels installed to satisfy a target and left to idle. Both readings are wrong, and the more useful position sits between them: 2023 settled the question of whether China can build clean generation fast enough, and replaced it with a harder question about whether its grid, market and dispatch rules can absorb what is being built.
What the statistics actually say
The NEA table is short, and each line carries information. Solar capacity rose 55.2 per cent year on year. Wind rose 20.7 per cent. Hydropower barely moved, up 1.8 per cent to about 421 GW, and nuclear grew 2.4 per cent to about 57 GW. Thermal capacity, which is overwhelmingly coal, still rose 4.1 per cent to about 1,390 GW. That last figure matters. China did not substitute solar for coal in 2023. It added both.
Investment data point the same way. Major generating companies completed 967.5 billion yuan of power source investment, up 30.1 per cent, while grid investment rose only 5.4 per cent to 527.5 billion yuan. Generation spending is running well ahead of wires spending. For a system adding more than 290 GW of variable capacity in one year, that imbalance is the most important line in the release.
Utilisation confirms the strain. Average operating hours at plants of 6 MW and above fell by 101 hours to 3,592. Hydropower hours dropped by 285, reflecting a dry year, while thermal hours rose by 76. In plain terms, coal plants worked harder in 2023 even as record clean capacity arrived, because hydro output disappointed and demand kept rising.
The renewables share in context
The NEA's January review of renewable development, released in early February, puts the year in a wider frame. Renewable capacity reached 1,516 GW by the end of December, 51.9 per cent of the national fleet. Renewables accounted for 82.7 per cent of new capacity added in 2023 and, by the NEA's own estimate, about half of all renewable capacity added worldwide. Renewable generation approached 3,000 TWh, close to one third of national electricity consumption.
The same review notes that China produced more than 80 per cent of global output at every stage of the solar supply chain, from polysilicon to modules, and more than 70 per cent of key wind turbine components. That industrial base explains the speed. When module prices fall and domestic manufacturers need volume, deployment follows. The December figure alone, roughly 53 GW of solar connected in a single month according to pv magazine's reading of NEA data, shows how much of the build is pushed through at year end to meet provincial and corporate targets.
Distributed solar changes the problem
A large part of the 2023 solar build sat on rooftops and in industrial parks rather than in desert bases. That matters for planning. Utility-scale plants in the north-west need long-distance transmission to reach coastal demand centres. Distributed systems inject power into distribution networks that were never designed for reverse flows at midday. Both create integration costs, but of different kinds, and the institutions responsible for each are different. Provincial grid companies and local distribution operators bear the rooftop problem. State Grid's ultra-high-voltage programme bears the desert problem.
Our view is that the distributed segment will be the first to hit a hard ceiling. Several provinces have already begun to publish hosting capacity assessments and to slow approvals in saturated counties. Expect more of that in 2024, along with time-of-use tariffs that pay less for midday exports.
Why coal is still being built
It is tempting to read continued coal additions as a contradiction. It is better read as a hedge. The droughts and heat waves of 2022, which forced power rationing in Sichuan and elsewhere, left planners with a strong preference for dispatchable capacity they control. Coal plants built now are increasingly justified as capacity reserves rather than baseload energy suppliers, and the falling utilisation hours across the fleet over time will tell whether that framing holds.
The investment risk is obvious. A coal plant that runs 3,000 hours a year instead of 5,000 earns far less from energy sales, and China's capacity payment mechanism for coal, announced in late 2023 and starting in 2024, is the policy answer. It pays plants to be available rather than to generate. That is a reasonable design for a system with rising variable output, provided the payment is not so generous that it locks in surplus capacity for decades.
Three things to watch in 2024
First, curtailment. National wind and solar utilisation rates have been high in recent years, but they are averages. Watch provinces in the north-west, where rapid additions meet limited local demand and constrained export lines. If provincial curtailment rises, it will be the clearest sign that the build has outrun the grid.
Second, grid investment. A 5.4 per cent rise in wires spending against a 30 per cent rise in generation spending is not sustainable. The 2024 figures for grid investment will show whether State Grid and China Southern Power Grid are catching up. We expect a material acceleration, because the alternative is stranded clean capacity.
Third, the market. China's provincial spot markets are still developing, and most renewable output is sold at regulated or negotiated prices. As the volume of solar generation concentrated in the middle of the day grows, those arrangements will face pressure. The policy signal to watch is any move towards full market exposure for new renewable projects.
The position
China's 2023 statistics prove that manufacturing scale and political direction can deliver clean capacity at a pace no other country has matched. They do not yet prove that the capacity will displace coal generation at the same pace. The system added solar and coal together, ran coal harder, and underinvested in the network that connects the two.
The policy priority for 2024 is therefore not more megawatts. It is grid investment, flexible dispatch, and pricing that rewards generation when and where it is needed. If those follow, the 2023 record will be remembered as the year China's power sector turned. If they lag, it will be remembered as the year the build outran the system.