
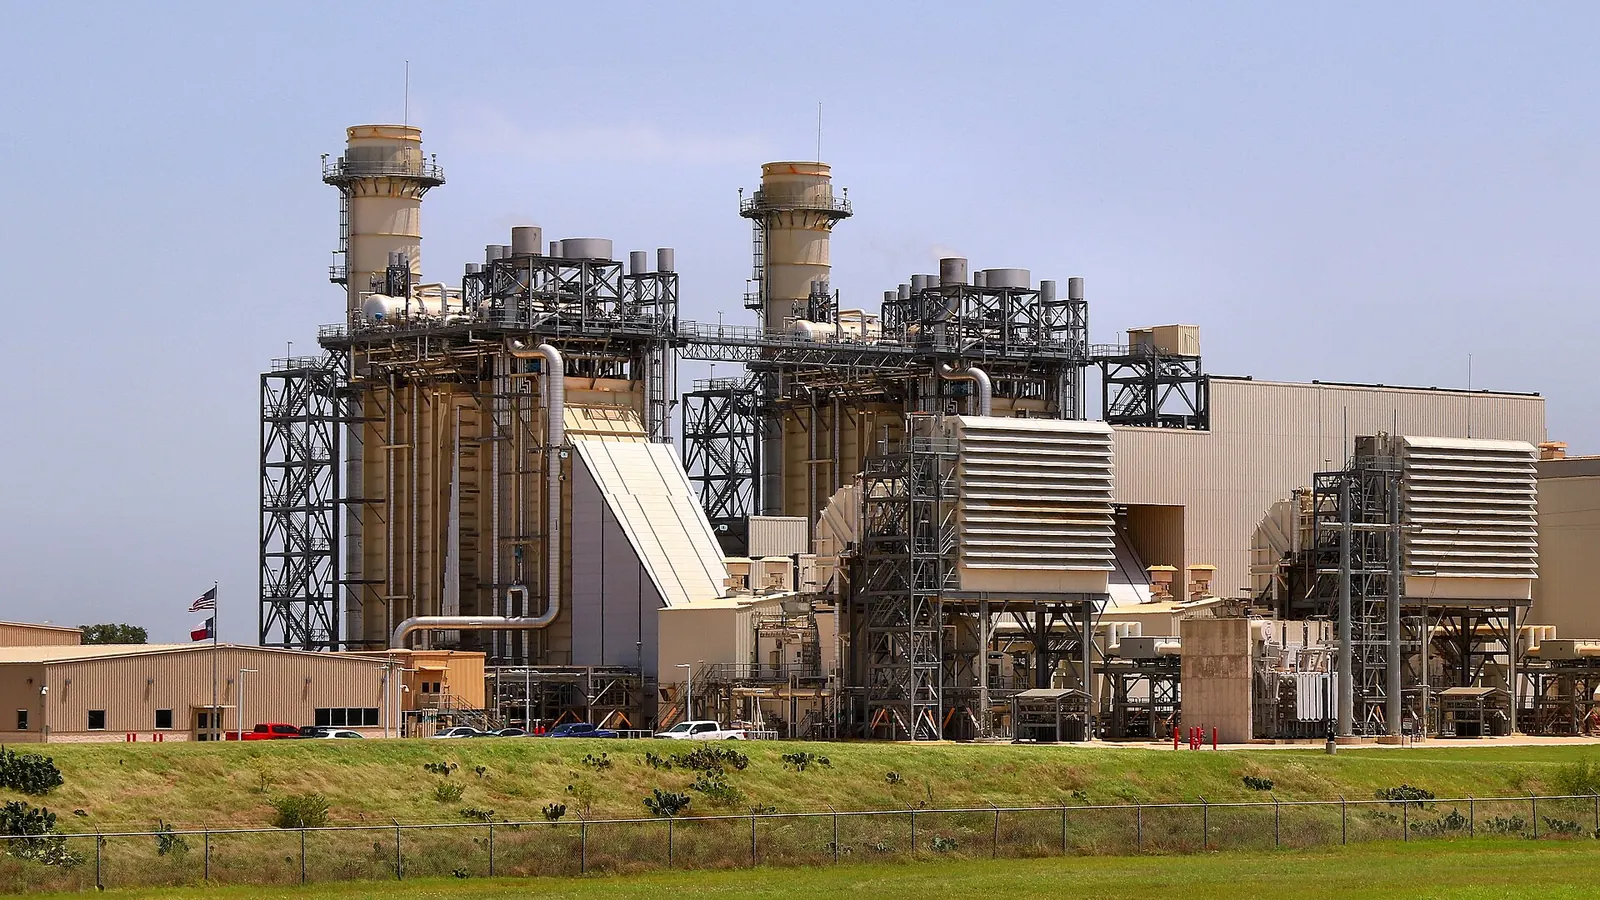
The first half of 2024 gave the US gas market its lowest prices in a generation. The Henry Hub monthly average fell from $3.18 per million British thermal units in January to $1.49 in March, which the Energy Information Administration says was the lowest inflation-adjusted monthly average since at least 1997. Over the six months from January to June, the monthly price fell 20% to $2.56.
Then came July. On July 9, power plants in the Lower 48 burned enough gas to generate 6.9 million megawatthours of electricity in a single day, probably the most in history and certainly the most since the EIA began collecting hourly data in January 2019. At the same time, storage injections were running well below normal.
These two halves of the year are connected. The price collapse was caused by a surplus built up over a warm winter. The summer data show that surplus being worked down faster than many expected, mostly by the power sector. The question for the rest of 2024 is how much of the cushion will be left when winter arrives.
How the surplus was built
The EIA's explanation of the low prices is a familiar one by now. Prices fell through much of 2023 on record production, flat consumption and high inventories. Dry gas production averaged 106 billion cubic feet per day in November and December, the most ever, at a time when warm weather reduced demand for space heating. The winter of 2023 to 2024 was the warmest on record. Very little gas was withdrawn from storage compared with a normal winter, and the season ended with inventories well above average.
The March price of $1.49 was the result. With storage full and production high, there was nowhere for additional gas to go. Producers, particularly in the Haynesville and Appalachia where dry gas is drilled for its own sake, responded by deferring completions and curtailing some output. That supply response is one reason prices recovered somewhat into the summer.
How the surplus is being drawn down
By the week of July 12, gas in Lower 48 storage totaled 3,209 billion cubic feet. That was 17%, or 465 Bcf, above the five-year average and 8% above the same week of 2023. The surplus remains large.
But the direction has changed. Net injections since April 1 had totaled 950 Bcf by the EIA's July 18 report. That was 15%, or 166 Bcf, less than the 2019 to 2023 average for the same period, and 15% less than in 2023. In other words, the market is adding gas to storage much more slowly than usual, which means the surplus that began the season is shrinking week by week.
Some of that reflects lower production after producers' cutbacks. Much of it reflects demand, and the July generation record shows where.
The power sector as the swing buyer
The EIA attributes the July 9 spike to two things: high temperatures across most of the country, and a steep drop in wind generation. That combination is likely to become more common as the fleet changes. When wind fails during a heat wave, gas plants are the main resource available to fill the gap in most regions.
Low prices made that gas burn easier. At under $3, gas undercuts coal in most of the country, so a heat wave that would once have been met partly by coal is now met mostly by gas. The power sector has become the shock absorber of the US gas market. It takes more gas when prices are low and when weather drives demand up, and less when prices are high.
That makes the power sector's demand price-sensitive in a way that heating demand is not. A cold January will raise heating demand regardless of price. A hot July will raise power burn, but how much of that comes from gas depends on gas's price relative to coal. In 2024, gas has been cheap enough to take almost all of it.
What this means for winter
The arithmetic for the end of the injection season, at the close of October, is straightforward. If injections continue to run below average, the surplus over the five-year average will narrow. The market will still enter winter with more gas than normal, but by a smaller margin than it held in spring.
That matters because of what is coming in 2025. New LNG export capacity is scheduled to start up, and each new train takes gas steadily from the domestic market. A narrower storage cushion going into the 2024 to 2025 winter, followed by rising export demand, sets up a market that is much less comfortable than the March price suggested.
Prices are likely to respond before that point. A surplus of 465 Bcf in mid-July still leaves plenty of room, so the issue is direction rather than level. As the summer burn continues and injections lag, the market has every reason to start pricing the end of the surplus well before the first cold snap.
Three risks to the comfortable view
The first is a hot August or September. Each additional heat wave raises power burn and slows injections further, especially if wind output is weak again.
The second is a slow production recovery. Producers that cut output in spring have to decide when to bring it back. If they wait for prices to rise further, the market could tighten faster.
The third is a cold early winter. A strong surplus is the best protection against a cold December, and the surplus is shrinking.
A low-price year with a short memory
The first half of 2024 will be remembered for its record low prices. The more important number may be the slower injection rate that followed. It shows that the US gas market is not as oversupplied as the March price implied, and that the power sector, responding to cheap gas and hot weather, can absorb a surplus faster than the old seasonal patterns would suggest.
For buyers, that argues for caution in assuming low prices will persist into 2025. For producers, it suggests the curtailments of the spring may not need to last long.