
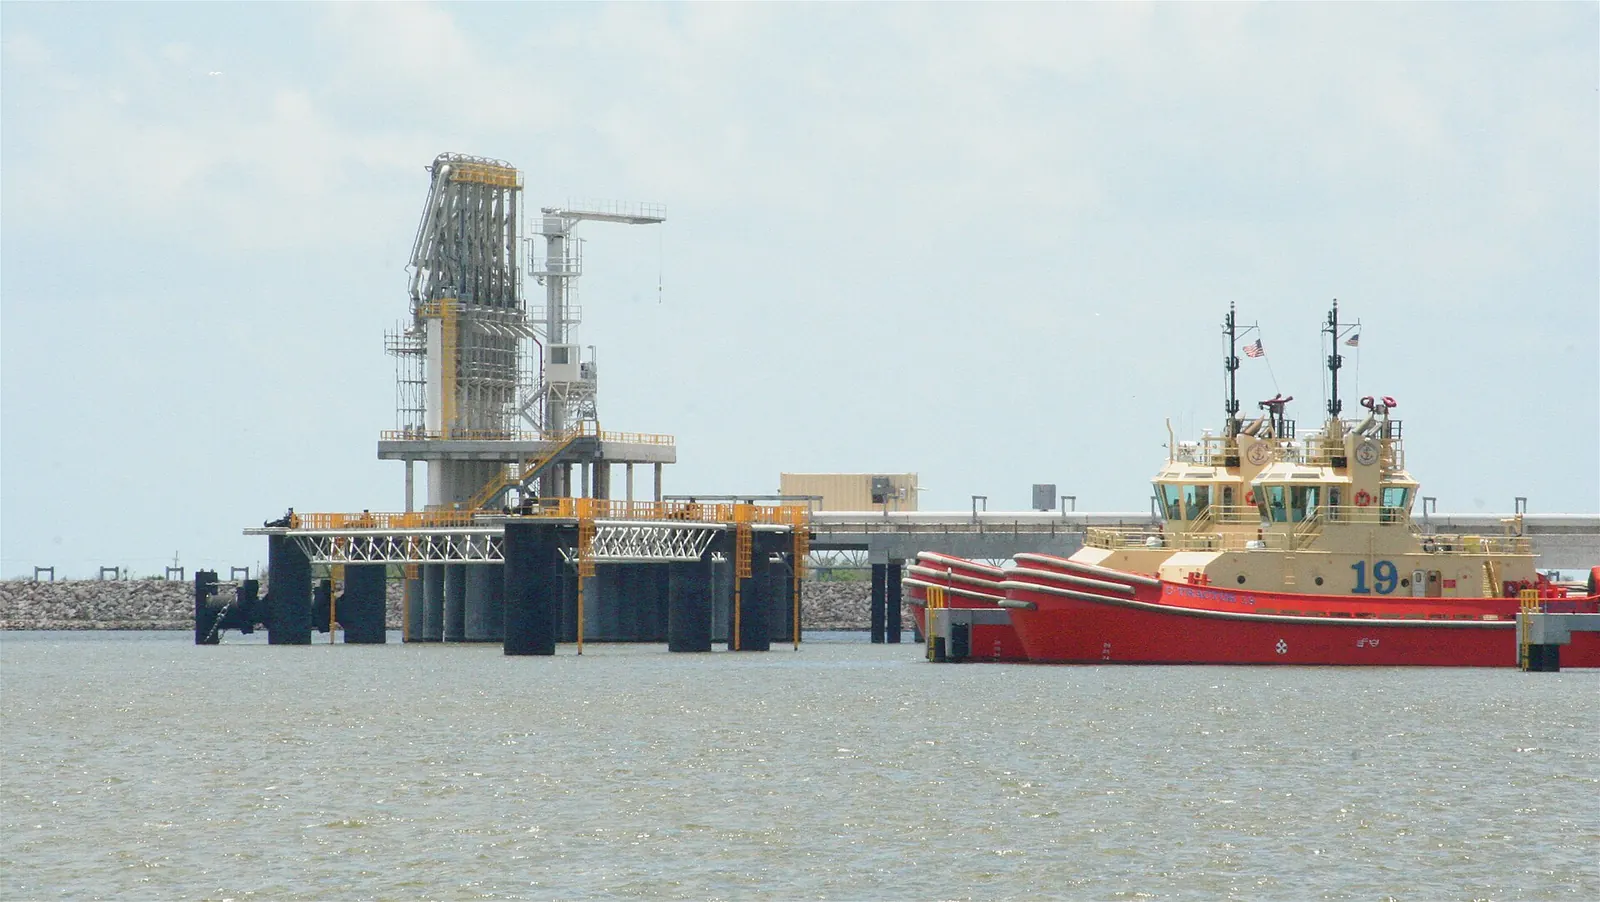
According to the United States Energy Information Administration, the United States exported 11.9 billion cubic feet per day of liquefied natural gas in 2024 and remained the world's largest LNG exporter. Australia and Qatar, the next-largest exporters, shipped between 10.2 and 10.7 billion cubic feet per day annually over 2020 to 2024. Russia's exports averaged 4.4 billion cubic feet per day in 2024 and Malaysia's 3.7. Those figures frame a year that looked quiet on total US volumes yet busy on destination shifts and late-year capacity news.
Why volumes were essentially flat
EIA states that United States LNG exports remained essentially flat compared with 2023 mainly because of unplanned outages at existing facilities, lower natural gas consumption in Europe, and very limited new LNG export capacity additions since 2022. In December 2024, Plaquemines LNG Phase 1 shipped its first export cargo, becoming the eighth United States LNG export facility in service. Utilisation of export capacity, measured against nominal and peak metrics discussed by EIA, was described as unchanged from the previous year in the agency's account.
Destination rotation
Europe including Türkiye remained the primary destination in 2024 at 53 percent, or 6.3 billion cubic feet per day. The Asian share rose from 26 percent (3.1 billion cubic feet per day) in 2023 to 33 percent (4.0) in 2024. Other regions, including the Middle East, North Africa and Latin America, took 14 percent (1.6 billion cubic feet per day), up from 8 percent (0.9). United States exports to Europe decreased by 19 percent, or 1.5 billion cubic feet per day, mostly to EU countries and the United Kingdom, after a mild 2023-24 winter and with expanded European import capacity in the background. The Netherlands, France and the United Kingdom together took 46 percent (2.9 billion cubic feet per day) of the European total. Germany averaged 0.6 billion cubic feet per day in both 2023 and 2024. In Asia, Japan, South Korea, India and China together took 76 percent (3.0 billion cubic feet per day) of United States volumes to the region. Egypt imported 0.3 billion cubic feet per day from the United States, its first such imports since 2018.
Policy overlay
The January 2024 DOE pause on new non-FTA authorisations, documented by the Congressional Research Service, shaped the forward project pipeline even as operating terminals continued to ship. Flat 2024 volumes therefore should not be misread as a structural retreat from export leadership. They reflect outages, European weather, and the lag before new trains such as Plaquemines contribute materially.
Power-market implications
Flat export growth eases, at the margin, near-term feedgas competition with power burn relative to a high-ramp year. It does not remove competition from an eight-terminal fleet. Power planners should still stress-test winter peaks with high LNG nominations. Basis risk remains the channel through which export activity hits generators far from Henry Hub.
Looking into 2025
The commercial question for 2025 is how quickly new capacity ramps and how European and Asian call on United States cargoes evolves with storage and relative prices. Analysts should update from EIA Natural Gas Monthly tables and STEO revisions rather than from anecdotes. Leadership in global LNG is a utilisation and destination story as much as a capacity story. In 2024 the United States kept the leadership badge with little volume growth and a clear pivot toward Asia and non-European markets.
The practical discipline is unchanged across fuel types and market constructs. Read the primary docket or statistical release before arguing about national destiny. Separate nameplate megawatts from accredited capacity, and contracted offtake from commissioned trains. Map interconnection and transmission lead times onto customer energisation promises rather than the other way round. Treat winter and summer extreme cases as design conditions. When federal policy shifts, update the slope of the forecast without rewriting physical laws. When state commissions push back on cost allocation, treat that push-back as part of the build path rather than as noise. United States energy infrastructure is financed, permitted and operated by people who must reconcile those constraints daily. Analysis that ignores them will not survive first contact with a peak day. Regional operators will continue to publish winter assessments, summer reliability outlooks and interconnection status reports. Those documents, read together with EIA inventories and FERC orders, give a clearer picture than any single speech. Investors should price execution risk honestly. Policymakers should resist the urge to treat one statute or one survey table as the whole system. The grid is a machine. Machines care about margins, not metaphors.